A new oil or gas well can change the income profile of a mineral portfolio almost overnight. Production begins, new royalty revenue starts flowing, and the first few months can look dramatically different from the months that came before.
What happens next is just as important. Most wells do not keep producing at their initial rate. Production typically falls over time as reservoir pressure declines and the easiest hydrocarbons are recovered. That production pattern is described by a decline curve.
For a single mineral owner, a decline curve helps explain why income from one new well may be strongest early and then settle lower. For a diversified royalty portfolio, however, the more useful question is different: how do thousands of wells at different stages of life combine into one portfolio-level cash-flow stream?
That is the perspective that matters for Mineral Vault. Decline curves still matter, but they are only one layer of a much larger system that also includes well vintage, operator development activity, new drilling, reserve replacement, commodity prices, and the timing of royalty remittances.
1. A Decline Curve Describes Production – Not the Distribution Itself
A decline curve tracks how a well’s production rate changes after it begins producing. The curve is a physical description of the well, not a direct forecast of what an investor will receive in a given month.
That distinction matters because royalty income is affected by more than production volume. The realized price of oil, natural gas, and natural gas liquids can change. Operators can report and remit revenue on different schedules. Wells can experience temporary downtime or maintenance. Taxes, management fees, and other applicable items can affect the net amount ultimately distributed.
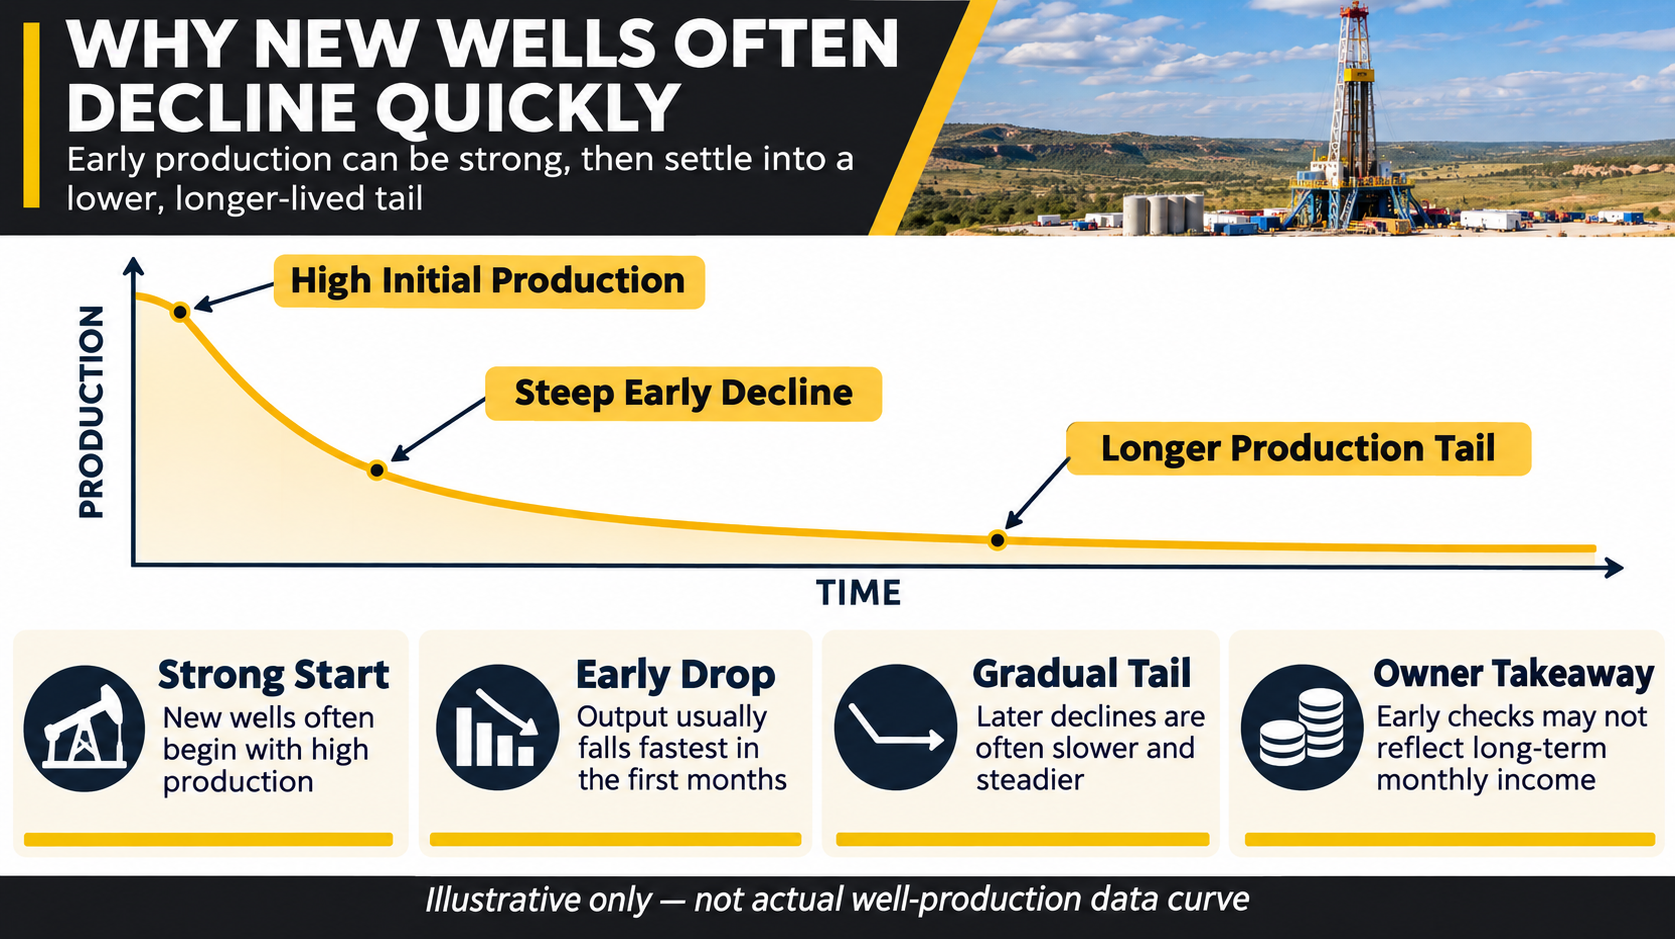
So if a new well produces less in month six than it did in month two, the corresponding royalty income may also fall – but not necessarily by the same percentage. A stronger commodity price can offset part of the production decline. A weaker price can amplify it. Timing differences can make the monthly pattern look even less linear.
The right way to use a decline curve is therefore as one input in understanding the economics of the underlying asset, not as a stand-alone prediction of a monthly token distribution.
2. Why Modern Horizontal Wells Often Look Front-Loaded
Modern horizontal wells are designed to expose a long section of the reservoir to the wellbore. Hydraulic fracturing creates pathways through which oil and gas can move toward the well, allowing large volumes of hydrocarbons to be produced relatively quickly after completion.
That engineering can create impressive early production, but it also means many horizontal wells experience a relatively steep initial decline. The U.S. Energy Information Administration has noted that horizontal wells generally have higher decline rates than vertical wells and that continued new-well development is required to offset declines from the existing well base.
In November 2025, the U.S. Energy Information Administration reported that Lower 48 crude-oil production from wells that came online in 2023 or earlier fell by 4.3 million barrels per day between December 2023 and December 2024. More than 15,000 new wells brought online in 2024 added 4.4 million barrels per day, enough to offset that decline. The same basic pattern appeared in natural gas.
That is a useful industry-level illustration of a simple truth: individual wells decline, while a producing system can remain stable or even grow when new production is continually added.
3. Think in Well Vintages, Not in One “Average” Well
One of the easiest mistakes in mineral investing is to imagine that every well in a portfolio is at roughly the same point in its life. In reality, a large portfolio contains many production vintages at once.
- Some wells may have just entered production and still be near their early high-output period.
- Others may be a year or two into their decline and producing at a lower, more normalized rate.
- Mature wells may have moved into a slower-declining production tail.
- Some acreage may not yet have been drilled at all, leaving future development potential outside current production.
Those different vintages matter because they prevent the entire portfolio from moving in lockstep. A newly completed well can add a fresh production curve at the same time older wells are declining. A mature well can keep contributing a smaller but longer-lived stream. Undeveloped acreage can create another future vintage if an operator decides to drill.
The portfolio is therefore better understood as a stack of overlapping production curves rather than one curve multiplied by the number of wells.
4. A Single New Well Can Move Income – but the Portfolio Context Matters More
When a new well comes online, its early production can create a noticeable step-up in royalty income tied to that property. If the well is highly productive, the increase can be substantial. As the well moves through its early decline phase, that incremental contribution generally begins to moderate.
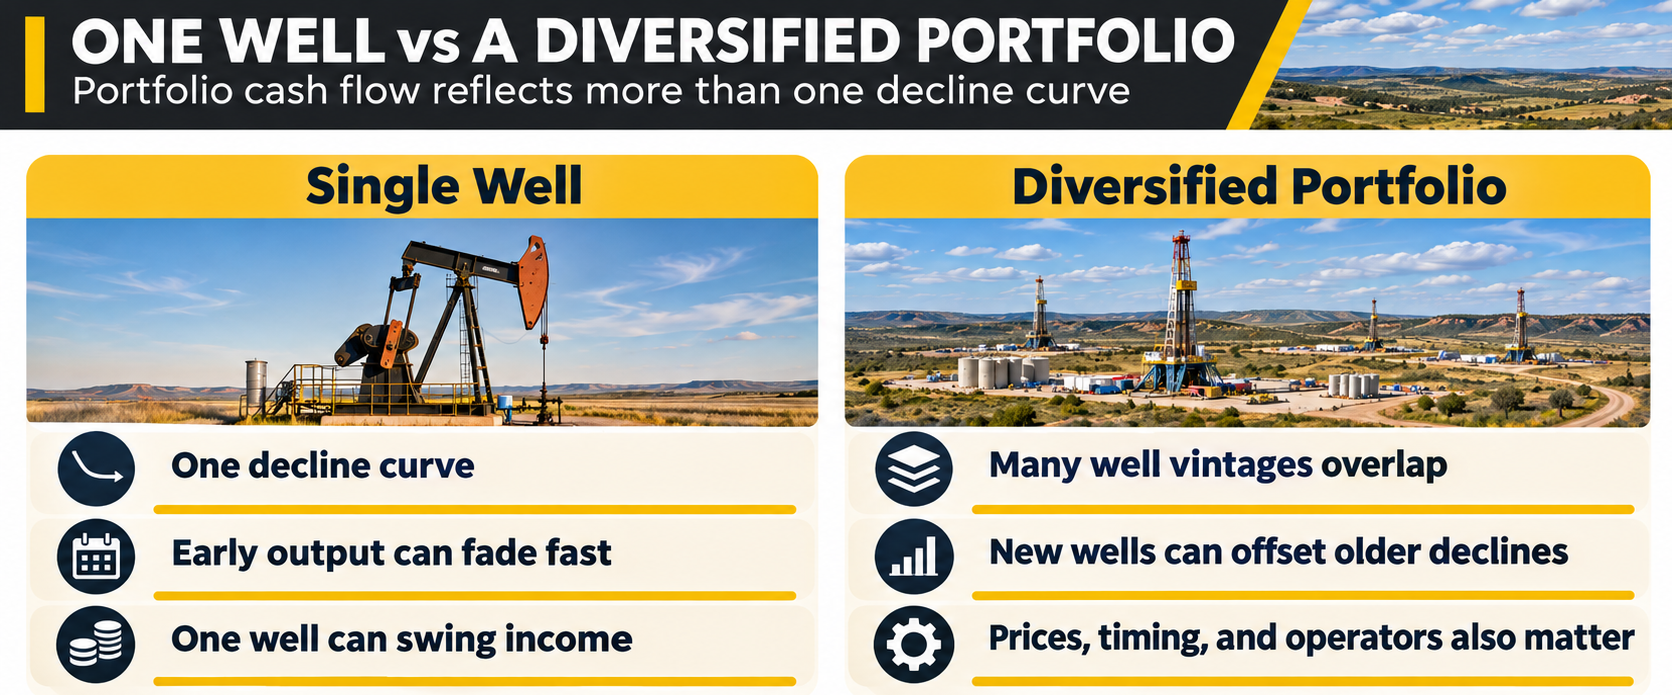
In a concentrated mineral interest, the owner may feel that change directly because one or two wells dominate the income stream. In a diversified portfolio, the effect is blended with the performance of many other wells. Some are declining, some are stable, some may be temporarily offline, and others may be entering production.
This is why one new well should not be treated as the new permanent run rate for the entire portfolio. It is better viewed as one new layer of production being added to an existing base.
The same logic works in reverse. A declining well does not automatically imply that the portfolio itself is declining at the same rate. The aggregate result depends on what is happening across the rest of the asset base at the same time.
5. Reserve Replacement Is the Bridge Between Decline and Portfolio Longevity
Decline curves explain why production from existing wells falls. Reserve replacement explains how a large mineral portfolio can partially offset that decline over time.
For mineral and royalty interests, reserve replacement can occur when operators drill additional wells on acreage already represented in the portfolio. A new well creates a new production stream without requiring the mineral owner to fund the drilling and completion costs in the way a working-interest owner would.
This is particularly important for Mineral Vault because the portfolio is not simply a collection of producing wells frozen in time. Mineral Vault I includes exposure to more than 2,500 producing wells, more than 150 operators, 9 U.S. states, and more than 10,000 gross acres of entity-owned acreage where additional development may occur over time.
In a portfolio of that scale, new wells coming online can become a recurring feature rather than a one-time event. Some new wells may add only modest incremental production. Others may be more meaningful. Taken together, those additions can lessen the overall depletion rate of the portfolio by replacing part of the production that older wells naturally lose.
Reserve replacement does not eliminate depletion, and it should never be presented that way. The portfolio remains exposed to natural production decline. The important point is that aggregate depletion can be materially softer than the decline curve of any one underlying well when fresh production continues to enter the system.
6. Operator Development Cadence Determines When New Curves Enter the Portfolio
Mineral owners do not control the drill bit. Operators decide when to permit, drill, complete, maintain, shut in, or recomplete wells. That makes operator activity an important link between undeveloped acreage and future royalty income.
A high-quality operator may have the technical capability, balance-sheet strength, acreage strategy, and infrastructure access to continue developing a property. A weaker or less active operator may delay drilling even when attractive locations remain. Commodity prices, service costs, takeaway capacity, lease obligations, and corporate capital-allocation decisions can all influence timing.
This is why operator diversification matters alongside well diversification. Mineral Vault I is exposed to more than 150 operators, reducing dependence on the development schedule of any single company. New wells do not arrive on a fixed timetable, but a broad operator base creates multiple independent pathways for future development across the portfolio.
The result is a more dynamic system: old curves are declining while new curves can be added at different times by different operators in different regions.
7. Portfolio Decline Is Not the Same as Well Decline
This distinction is the heart of the article.
A single well has one production history. Once it reaches peak production, the long-term direction is generally downward, even if temporary operational changes create bumps along the way.
A large royalty portfolio has thousands of production histories. The aggregate curve is the sum of all of them, including new curves that may be introduced later. That means the portfolio-level decline rate is determined not only by how quickly existing wells are fading, but also by how much new production is being added.
At the U.S. industry level, EIA data show this process clearly. In 2024, declines from older Lower 48 wells were roughly offset by production from newly completed wells. That does not mean every portfolio will reproduce the national pattern, but it demonstrates the mechanism that makes reserve replacement economically meaningful.
For investors, the practical implication is that evaluating a diversified mineral portfolio by looking at a typical single-well decline curve can be misleading. The more relevant question is how the mix of mature production, recent completions, future drilling inventory, and operator activity changes over time.
8. Decline Curves Are Only One Reason Monthly Distributions Move
A new well’s production profile can influence royalty distributions, but it is not the only factor. Even if the production trend is behaving exactly as expected, monthly cash flow can still move because of other variables.
- Commodity prices: realized oil and gas prices can rise or fall independently of production volume.
- Product mix: the relative contribution of oil, natural gas, and NGLs can change the revenue generated by the same total production volume.
- Reporting and remittance timing: operator payments may not line up perfectly with the calendar month in which production occurred.
- Operational events: maintenance, shut-ins, weather, infrastructure constraints, and workovers can temporarily alter output.
- New development: one or more new wells can add fresh production and temporarily lift aggregate portfolio cash flow.
- Taxes, fees, and other applicable items: the amount distributed to token holders reflects the economics after the relevant portfolio-level adjustments.
This is why Mineral Vault distributions should be interpreted over time rather than judged by one unusually strong or weak month. A distribution is the end result of many moving parts, and decline curves explain only the production component of that equation.
9. A Better Way to Read the Cash-Flow Pattern
Instead of asking whether one month was higher or lower than the previous month, investors can use a more useful set of questions:
- Were production volumes broadly higher or lower across the portfolio?
- Did any significant new wells begin contributing?
- Are recent wells moving from high initial production into a more normalized decline phase?
- Did commodity prices move enough to amplify or offset the production change?
- Was the month affected by timing, adjustments, or operator-specific remittance patterns?
- Is new drilling elsewhere in the portfolio replacing some of the decline from older wells?
This framework turns a decline curve from a source of concern into a tool for interpretation. A lower production rate from a new well is not necessarily evidence of a problem. It may simply mean the well is progressing through the production lifecycle that was expected from the beginning.
Likewise, a strong portfolio distribution does not necessarily mean every well is producing more. It may reflect new wells, stronger pricing, favorable product mix, timing effects, or a combination of several factors.
10. Why Transparency Matters More When Cash Flow Is Variable
Variable income is easier to understand when investors can see what sits behind it. Mineral Vault publishes monthly dividend reports and supporting materials through its transparency portal so investors can follow the cash-flow history rather than relying on a single headline number.
That transparency is especially important for a depleting real asset. The goal is not to pretend that well production stays flat. It is to make the moving pieces visible: current production, new development, portfolio diversification, reserve replacement, and the cash ultimately distributed to token holders.
A well decline curve is therefore not a warning sign by itself. It is one of the core mechanics of oil and gas production. What matters is how that decline interacts with the rest of the portfolio.
Final Thoughts
New wells often arrive with strong early production and then decline. That pattern is normal, especially for modern horizontal wells, and it is one reason royalty income should never be projected by simply annualizing the first few months of a new well.
But Mineral Vault investors are not exposed to one new well in isolation. They are exposed to a diversified mineral and royalty portfolio containing thousands of wells at different stages of life, spread across many operators and regions, with additional development potential on existing acreage.
That changes the way decline should be understood. Individual wells still deplete. The portfolio can still experience lower production over time. But when new wells continue to come online, they introduce new production vintages that can offset part of the decline from older wells and lessen the portfolio’s aggregate depletion rate.
The result is not a flat cash-flow line and it is not a guarantee of reserve replacement. It is a more realistic way to think about a large mineral portfolio: as a living system of overlapping decline curves, new development, changing prices, and operator activity rather than as one well multiplied many times.
Disclaimer: This article is educational in nature and should not be considered investment, tax, legal, accounting, or engineering advice. Oil and gas production behavior varies materially by well, basin, geology, completion design, operator, commodity prices, and other factors. Past or current cash flow does not guarantee future distributions, reserve replacement, token value, or investment performance.
 From Tokenized Stocks to Tokenized Royalties: What the Next Phase of RWA Investing Looks Like
 Oil-Weighted vs. Gas-Weighted Mineral Interests: Why Commodity Mix Matters
 Passive Ownership, Active Operators: Why Operator Quality Matters in Mineral Investing